Understanding Data Viz Methods
Data visualization is the art of transforming complex data into visual formats that are easy to understand and interpret. It’s a powerful tool that helps people see patterns, trends, and outliers in information that would otherwise be difficult to grasp. Understanding data viz methods means learning how to effectively represent data through charts, graphs, maps, and other visual elements to communicate insights clearly.
Whether you're a marketer analyzing customer behavior, a teacher presenting statistics to students, or a business owner tracking sales performance, data visualization plays a critical role in decision-making. The right visual can turn raw numbers into compelling stories, making it an essential skill for anyone working with data.
Why Data Visualization Matters to Different Audiences
Understanding data viz methods isn’t one-size-fits-all. Its importance varies depending on your role, goals, and how you interact with data. For example:
- Beginners may focus on learning basic tools and techniques to make sense of data without getting overwhelmed by complexity.
- Professionals might prioritize accuracy, clarity, and the ability to present data in a way that supports strategic decisions.
- Creators could look for flexibility and creativity to design visually engaging content that captures attention.
- Business owners often care about cost-effectiveness and scalability, ensuring their data solutions grow with their needs.
- Educators may seek tools that simplify teaching abstract concepts, making them more accessible to students.
- Consumers benefit from clear, intuitive visuals that help them make informed choices, whether it's understanding financial reports or health data.
Each group has unique priorities when it comes to data visualization. Some may value ease of use, while others emphasize speed, reliability, or commercial value. Understanding these differences can help you choose the right approach for your specific needs.
How to Master Data Visualization Techniques
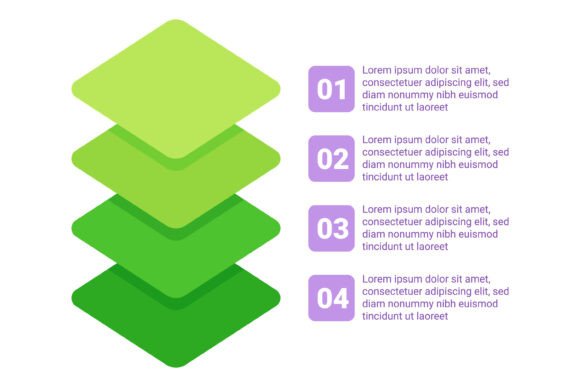
The journey to mastering data visualization starts with understanding the core principles and gradually building up to advanced practices. A well-structured infographic can serve as a valuable guide, breaking down the process into four progressive steps that make learning both logical and manageable.
Step 1: Define Your Objective
Before creating any visual, ask yourself: What do I want to communicate? Who is my audience? What action should they take after viewing the data? These questions help shape the direction of your visualization and ensure it aligns with your goals. For instance, a marketer might aim to show campaign performance, while a scientist might focus on illustrating research findings.
Step 2: Choose the Right Visual Format
Not all data is best represented in the same way. Bar charts work well for comparisons, line graphs show trends over time, and heatmaps highlight patterns in large datasets. Selecting the appropriate format ensures your message is clear and impactful. A small business owner might prefer simple pie charts for budget breakdowns, while a data analyst might opt for interactive dashboards for deeper exploration.
Step 3: Simplify and Clarify
Simplicity is key in data visualization. Avoid clutter, unnecessary details, and overly complex designs that distract from the main message. Use consistent color schemes, readable fonts, and clear labels. An educator might use bold colors and minimal text to engage students, while a financial professional might rely on clean, precise layouts to support analysis.
Step 4: Test and Refine
Once your visualization is created, test it with your target audience. Do they understand the message? Is there anything confusing or misleading? Gathering feedback allows you to refine your work and improve its effectiveness. A designer might test a new infographic with users to ensure it meets accessibility standards, while a researcher might share a draft with colleagues for peer review.
Practical Applications Across Roles
Understanding data viz methods isn't just about theory—it's about applying what you learn in real-world scenarios. Here are a few examples of how different roles might use these techniques:
- Marketers can use data visualization to track campaign success, identify customer preferences, and optimize strategies based on real-time insights.
- Bloggers might create infographics to illustrate key points in their articles, making complex topics more digestible for readers.
- Freelancers could use visual tools to present project proposals, showing clients how their work will deliver measurable results.
- Small business owners might leverage dashboards to monitor sales, inventory, and customer behavior, helping them make informed decisions quickly.
- Hobbyists could experiment with data visualization to explore personal interests, such as tracking fitness progress or analyzing music preferences.
Each application highlights the versatility of data visualization and how it can be tailored to fit individual needs and goals.
Choosing the Right Tools for Your Needs
There are countless tools available for creating data visualizations, from simple spreadsheet programs to advanced coding libraries. The choice depends on your skill level, the complexity of your data, and the purpose of your visual. For example:
- Beginners might start with user-friendly platforms like Canva or Google Sheets.
- Experienced users could explore tools like Tableau, Power BI, or Python libraries such as Matplotlib and Seaborn.
- Creators may prefer design-focused tools that allow for custom branding and aesthetics.
- Professionals might prioritize tools that integrate with existing systems and offer advanced analytics features.
Regardless of your starting point, the goal is to find a method that aligns with your objectives and enhances your ability to communicate data effectively.
Is Understanding Data Viz Methods Right for You?
If you’re looking to improve your ability to interpret, present, or create data-driven insights, then understanding data viz methods is a valuable investment. Whether you're a beginner seeking to build foundational skills or an expert aiming to refine your craft, there’s something to gain from this process.
Consider your current role, your long-term goals, and the type of data you work with. If you want to make your information more engaging, easier to understand, or more actionable, then exploring data visualization techniques is a step worth taking. With the right approach and resources, you can unlock new ways to connect with your audience and drive meaningful outcomes.